Proyectos
Muestra de trabajos en diseño y análisis de datos.
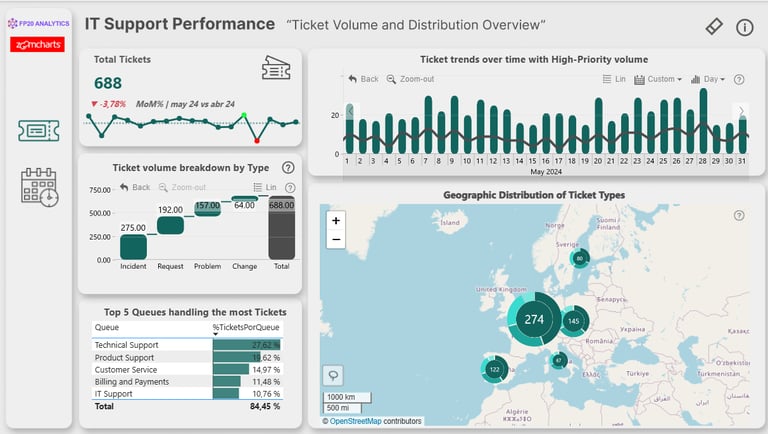
Dashboard de Soporte de IT
Desarrollé un dashboard interactivo para el análisis de más de 15.000 tickets de soporte técnico. El panel permite explorar tipos de tickets, tiempos de resolución, ubicaciones con mayor demanda y prioridades críticas.
Incluye un panel informativo que guía a los usuarios en la interpretación de los datos. El objetivo fue facilitar decisiones estratégicas para mejorar la eficiencia del soporte y la experiencia del cliente.

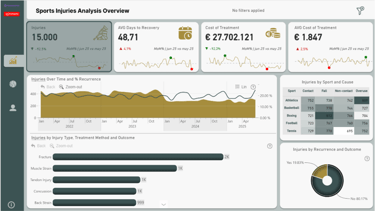
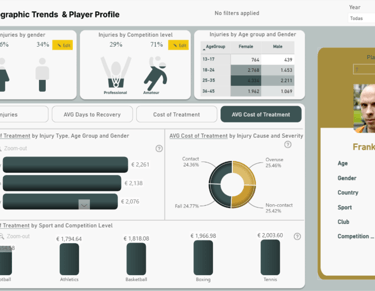
Dashboard de Lesiones deportivas
Este dashboard analiza lesiones deportivas desde múltiples perspectivas: género, grupo etario, tipo de lesión, severidad y resultado. Entre sus funcionalidades destaca el uso de KPI Cards como slicers, lo que permite una exploración dinámica e intuitiva de la información. También se incorporaron imágenes personalizadas para mostrar porcentajes, facilitando la interpretación visual de los datos.
Además, se diseñó una flip card interactiva para profundizar en los datos de cada jugador lesionado, ofreciendo un enfoque más detallado y atractivo en el análisis individual.
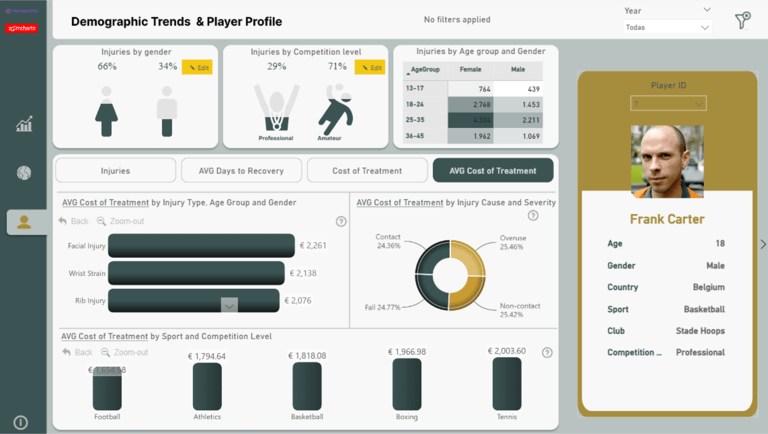
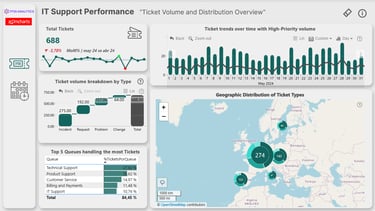
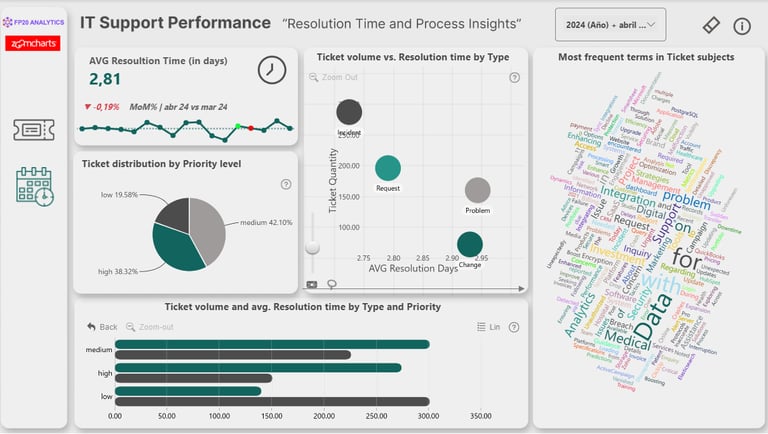
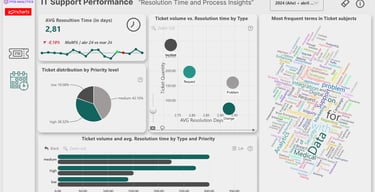
Dashboard de Soporte de IT
Desarrollé un dashboard interactivo para el análisis de más de 15.000 tickets de soporte técnico. El panel permite explorar tipos de tickets, tiempos de resolución, ubicaciones con mayor demanda y prioridades críticas.
Incluye un panel informativo que guía a los usuarios en la interpretación de los datos. El objetivo fue facilitar decisiones estratégicas para mejorar la eficiencia del soporte y la experiencia del cliente.
Dashboard de Análisis Bancario
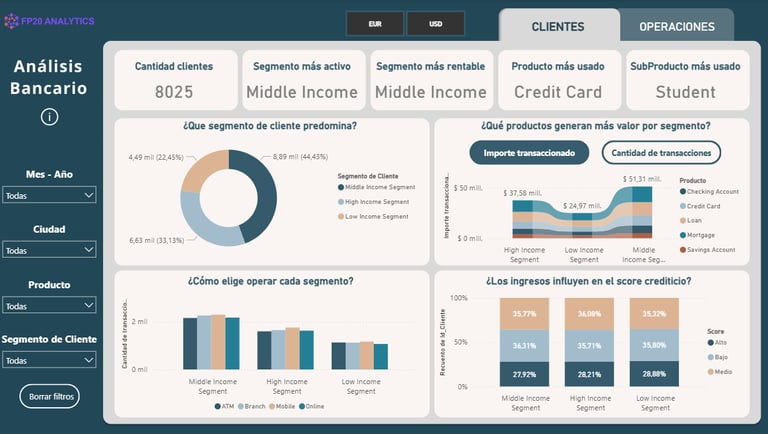

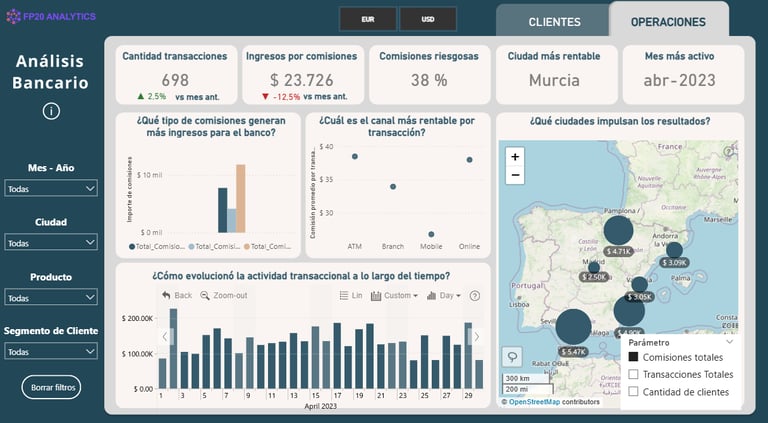
Diseñé un dashboard dinámico para analizar datos bancarios relacionados con clientes, productos financieros y comportamiento crediticio. El panel permite explorar segmentos de clientes, tasas de aprobación de préstamos, riesgos y oportunidades de fidelización.
Incluye un panel introductorio con instrucciones para facilitar la navegación y comprensión por parte de los usuarios. El objetivo fue aportar valor en la toma de decisiones comerciales y estratégicas basadas en datos.
Dashboard de Análisis de Cadena de Suministro
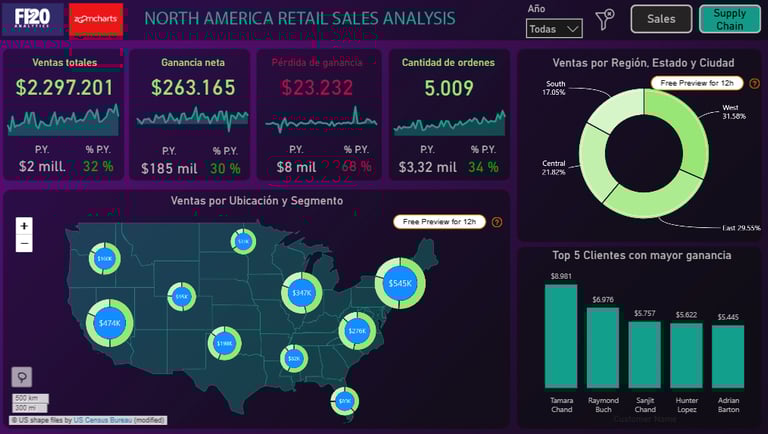
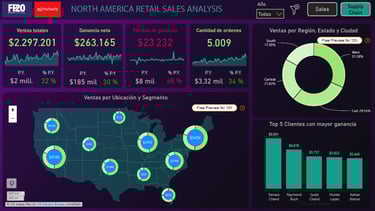
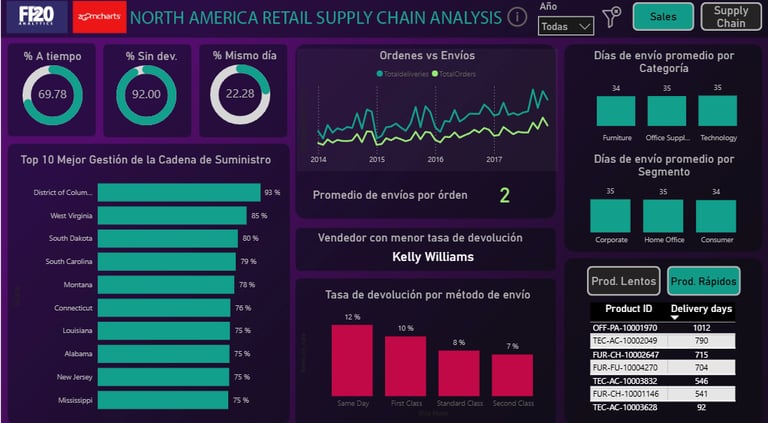
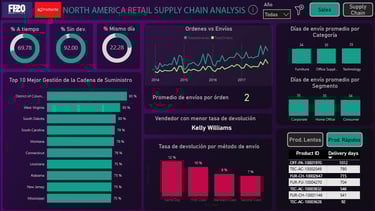
Creé un dashboard interactivo con PowerBi para analizar la eficiencia logística, enfocándome en indicadores clave como entregas a tiempo, devoluciones y despachos inmediatos.
El objetivo fue evaluar la gestión de la cadena de suministro desde una perspectiva operativa, más allá del volumen de ventas.
Proyectos
Muestra de trabajos en diseño y análisis de datos.


Análisis de datos
Proyecto de visualización de datos para empresa X.


Tableros personalizados
Diseño de tableros interactivos para mejorar decisiones.


Consultoría avanzada
Asesoría en implementación de sistemas de control.
Investigación profunda
Estudio completo sobre tendencias de datos en la industria.
→
→
→
→
+54-264 4772173
info@email.com
Samira Godoy Mir
Especialista en análisis y visualización de datos.
Diseño dashboards y automatizo procesos para optimizar operaciones en distintas industrias.


Proyectos
Explora el trabajo de Samira Godoy en análisis de datos.


